Maximum flow is one of the Network Optimization problems in Operations Research and can be solved in R by “igraph“, which is a network analysis package.
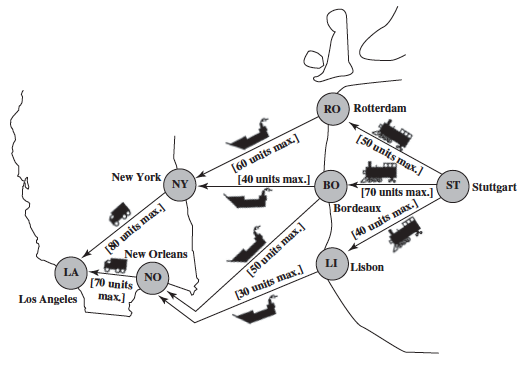
6.2 A CASE STUDY: THE BMZ CO. MAXIMUM FLOW PROBLEM
The function to solve maximum flow problem in igraph package is called max_flow.
Usage:
max_flow(graph, source, target, capacity = NULL)
Arguments:
graph: The input graph.
source: The id of the source vertex.
target: The id of the target vertex (sometimes also called sink).
capacity: Vector giving the capacity of the edges.
Code & Output:
# Loading "igraph" package
library(igraph)

# A data frame describing the flow and its capacity in each edge
E <- rbind(c("ST", "RO", 50), c("ST", "BO", 70), c("ST", "LI", 40), c("RO", "NY", 60), c("BO", "NY", 40), c("BO", "NO", 50), c("LI", "NO", 30), c("NY", "LA", 80), c("NO", "LA", 70))
colnames(E) <- c("from", "to", "capacity")
d <- as.data.frame(E)

# The input graph
g1 <- graph_from_data_frame(d)

# Call max_flow function
max <- max_flow(g1, source = V(g1)["ST"], target = V(g1)["LA"])
max
 $value
 [1] 150
 $flow
 [1] 50 70 30 50 30 40 30 80 70
 $cut
 [1] 8 9
 $partition1
 6/7 vertices, named, from a8c8712:
 [1] ST RO BO LI NY NO
 $partition2
 1/7 vertex, named, from a8c8712:
 [1] LA
 $stats
 $stats$nopush
 [1] 8
 $stats$norelabel
 [1] 2
 $stats$nogap
 [1] 0
 $stats$nogapnodes
 [1] 0
 $stats$nobfs
 [1] 1
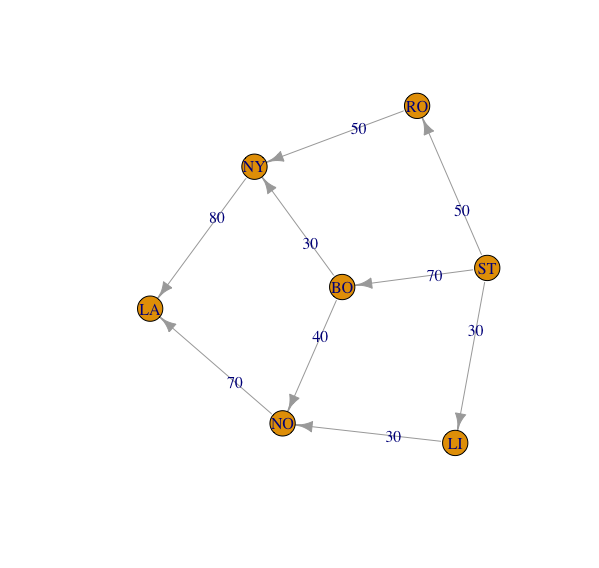
As the output showed, the optimal solution can be extracted from max$value and max$flow. We can also visualize the solution using plot() function.
# Plot the optimal solution
plot(g1, edge.label = max$flow)