Why Export Kindle Vocabulary Builder?
You may decide to export Kindle Vocabulary Builder for the following two reasons. First, Kindle only keeps up to a maximum of 2000 words, so your new words after 2000 will not be displayed in Kindle. Exporting and cleaning the vocabulary could help you backup it on a regular basis and keep reading.
Second, exporting the vocabulary out of kindle actually allows you to learn the vocabulary in a more efficient way. One of the features in Kindle Vocabulary Builder is that it keeps a record of the context (“usage”) every time you look up a word. That means each vocabulary keeps your lookup frequency. For example, below is the lookup frequency for my vocabulary from Harry Potter books.
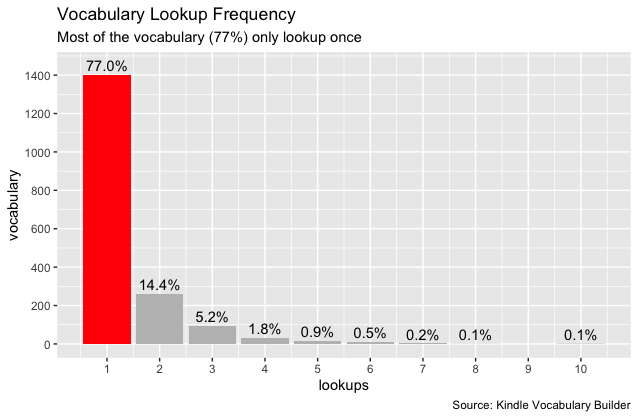
It shows that most of the vocabulary (77%) were only looked up once across seven Harry Potter books. Thus, I don’t think it makes sense to study this vocabulary. However, you can not distinguish this vocabulary in Kindle Vocabulary Builder, making it less efficient.
Continue reading