Custom Object in HubSpot is an enterprise feature which allows you to store customised information about your business, along with standardised objects such as Contacts, Companies and Deals.
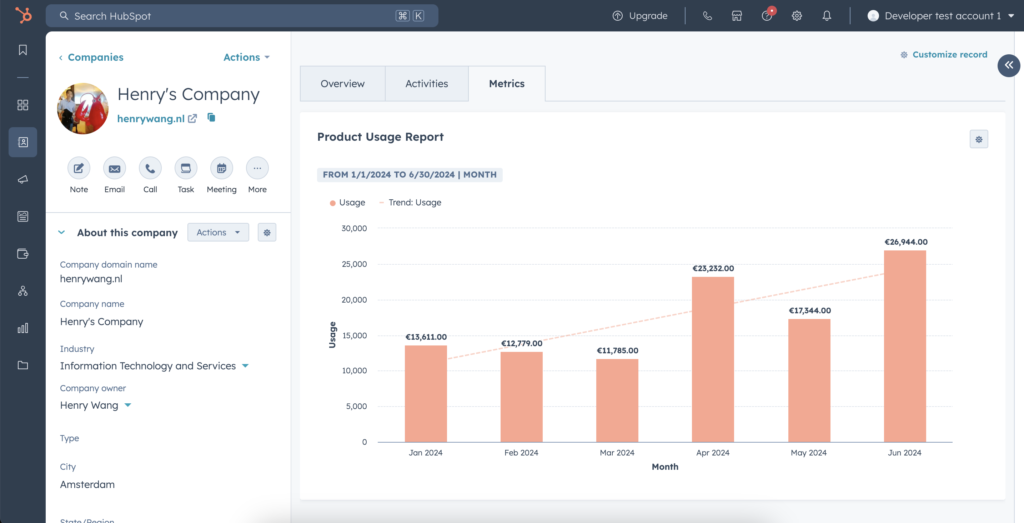
Depends on your business, you may have different use cases to leverage this flexibility. In this post I would like to share one of the use cases which I found very interesting to open to more possibilities: using Custom Objects to store metrics for reporting purpose.
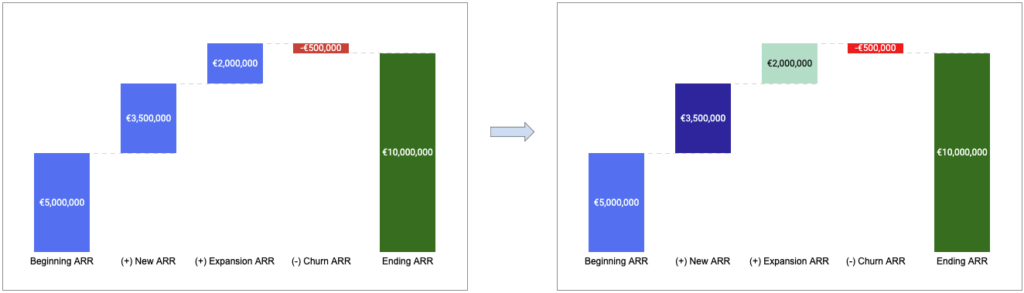
If you often work with dashboards and reports in HubSpot, you’ve definitely run into some limitations. For example, you cannot track and visualise historical data in a straightforward way. Taking lead scoring for instance, there’s a way to visualise how a lead score changes overtime, making it less transparent and difficult for sales to follow up.
Continue reading