Introduction
Hundreds and thousands of transactions occur every day in a supermarket, while a customer would buy multiple products in each transaction. For example, it may look like this in the database: {Transaction1: Product1, Product3, Product4, Product8, Product9}. In a larget data set of transactions, purchase patterns, i.e. some products are always bought together, can be examined based on product association analysis, also called Market Basket Analysis.
Key Concepts of Market Basket Analysis

Basically, there are four key concepts of Market Basket Analysis:
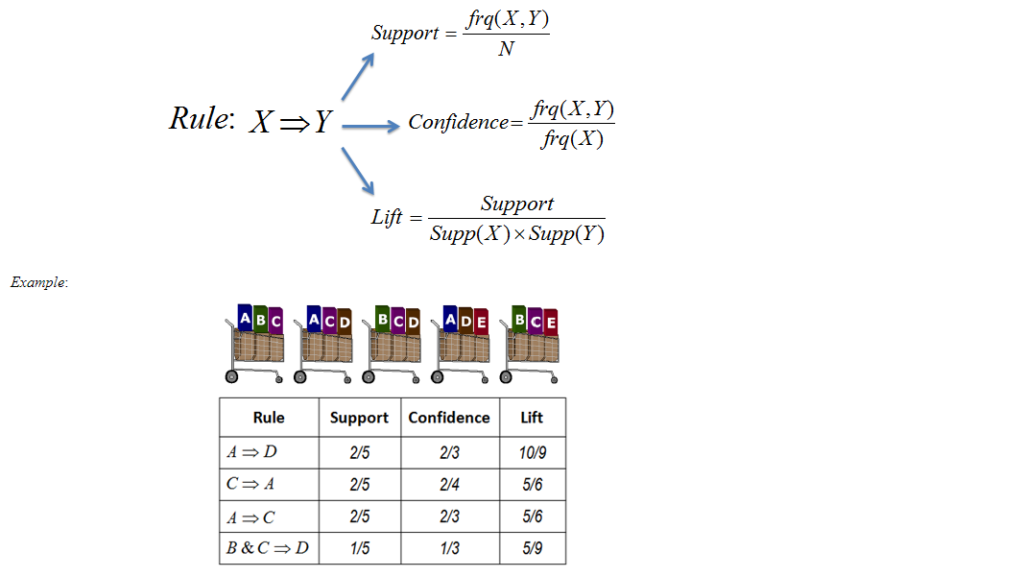
- Rule: a rule expresses the incidence across transactions of one set of items as a condition of another set of items, i.e. X => Y;
- Support: the support for a set of items is the proportion of all transactions that contain the set;
- Confidence: the support for the co-occurrence of all items in a rule, conditional on the support for the left-hand set alone;
- Lift: the support of a set conditional on the joint support of each element;
These three measures tell us different things. When we search for rules we wish to exceed a minimum threshold on each: to find
Example
The following is an example of how to do Market Basket Analysis using R with a large data set from a Belgian supermarket chain (http://fimi.uantwerpen.be/data/retail.dat).
Code
# Loading data
retail.raw <- readLines("http://fimi.ua.ac.be/data/retail.dat")

# Preparing data
retail.list <- strsplit(retail.raw, " ")
names(retail.list) <- paste("Trans", 1:length(retail.list), sep="")
retail.trans <- as(retail.list, "transactions")

# Loading "arules" package to use "apriori" algorithm
library(arules)

# Loading "arulesViz" package to visuliza the result
library(arulesViz)

# Run "apriori" algorithm
retail.rules <- apriori(retail.trans, parameter=list(supp=0.001, conf=0.4))

# Show the top 50 rules by "lift"
retail.hi <- head(sort(retail.rules, by="lift"), 50)

# Plot the first top 50 rules
plot(retail.hi, method="graph", control=list(type="items"))
Result

As shown above, items 696 and 699 form a tight set; there are item clusters for {3402, 3535, 3537}, {309, 1080, 1269, 1378, 1379, 1380}, and so forth; and item 39 appears as a key item in two sets of items that otherwise do not overlap.
Applications
Market Basket Analysis can contribute to supermarkets in various ways. First, supermarkets can use the output to optimize physical layouts in the stores. For example, supermarkets should put products of 3402, 3535, and 3537 together according to the analysis. Second, some creative marketing strategies could be made accordingly. Supermarkets put a discount promotion on product 696, for instance, while
Reference:
Chapman, C., & Feit, E. M. (2015). R for marketing research and analytics. Springer International Publish.
BWER Company provides Iraq’s leading-edge weighbridge solutions, designed to withstand harsh environments while delivering top-tier performance and accuracy.