Category Archives: R Programming

R Language Brief and R Applications

Transform List into Dataframe with tidyr and purrr

As a data structure in R, list is not as familiar to me as vector and dataframe. I knew that list is often returned by function calls but I didn’t pay much attention to it until I started working on the API wrapper package RLeadfeeder. It turned out that list can be very useful to hold all kinds of data returned from API platforms and I had to make an effort to learn how to work with it, namely extract useful elements from a list and turn them into a dataframe.

Transform Lists into Data Frames in R
Transform List into Data Frame in R

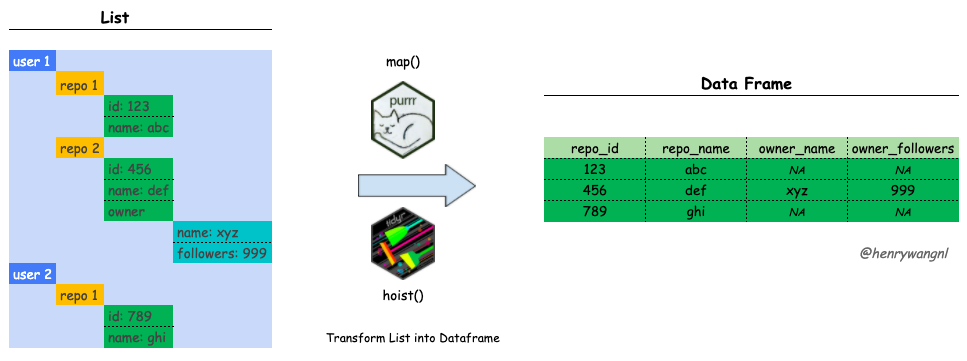
This post is an example of how to transfrom a list into a dataframe with two different approaches: tidyr and purrr. The packages used in this post are as follows:

Continue reading

httr Two Common Authentication Methods

What I just learned that there can be a couple of authentication methods used in R API wrapper packages but the most common ones are API Key and OAuth 2.0.

API Key

API Key normally can be generated on a developer dashboard and can be regenerated later for security reason.

API Key can be saved as an environment variable in a .Renviron file and then we can use Sys.getenv() to get access to it, as shown here: https://github.com/maelle/goodpress/blob/main/R/utils-http.R.

keyring package is another common way to manage API Key: key_set() to create api key and key_get() to get access to the api key, as shown here: https://github.com/lockedata/hubspot/blob/master/R/hubspot_key.R.

Lastly, there are two different ways to include an api key in api calls: including it as part of the URL or adding it in the HTTP header.

Continue reading

ROC Curve Simulation – Classification Performance

“A receiver operating characteristic curve, or ROC curve, is a graphical plot that illustrates the diagnostic ability of a binary classifier system as its discrimination threshold is varied. The ROC curve is created by plotting the true positive rate against the false positive rate at various threshold settings.” – Wikipedia

Simulation can be very useful for us to understand some concepts in Statistics, as shown in Probability in R. Here is another example that I used simulation to understand ROC Curve and AUC, the metrics in classification models that I had never fully understand.

Data

The simulation in this post was inspired by OpenIntro Statistics and the email dataset I used can be found in openintro package.

Continue reading

R Markdown to WordPress with goodpress

I have been writing a few posts about R on my blog and are getting annoyed with the workflow back and forth between RStudio and WordPress. Overall, the previous workflow has two main pitfalls making me frustrated:

  • R Code

Coping R code from RStudio and pasting it to WordPress can take me much time. Code highlight is also challenging, although eventually I figured out that the plugin of SyntaxHighlighter Evolved did a great job.

  • R Output

Often I need to export R outputs (e.g., ggplot2 plots) and upload them to WordPress, sometimes formatting them a bit.

Continue reading

Learning ggplot2 on Paper – Scale

The previous two posts in this series of learning ggplot2 on paper:

This post will continue to discuss another ggplot2 component, Scale. Let’s start with the graphs we drew in the last post of “Learning ggplot2 on Paper – Layer“, as shown here.

Figure 1
Continue reading