The previous two posts in this series of learning ggplot2 on paper:
This post will continue to discuss another ggplot2 component, Scale. Let’s start with the graphs we drew in the last post of “Learning ggplot2 on Paper – Layer“, as shown here.
The previous two posts in this series of learning ggplot2 on paper:
This post will continue to discuss another ggplot2 component, Scale. Let’s start with the graphs we drew in the last post of “Learning ggplot2 on Paper – Layer“, as shown here.
The previous post in this series: Learning ggplot2 on Paper – Components. The last post introduced ggplot2 seven components at a high level and how they are related to the way we draw math function graphs on paper in middle school.
This post will dive into the components of the layer, which is one of the most important ggplot2 components.
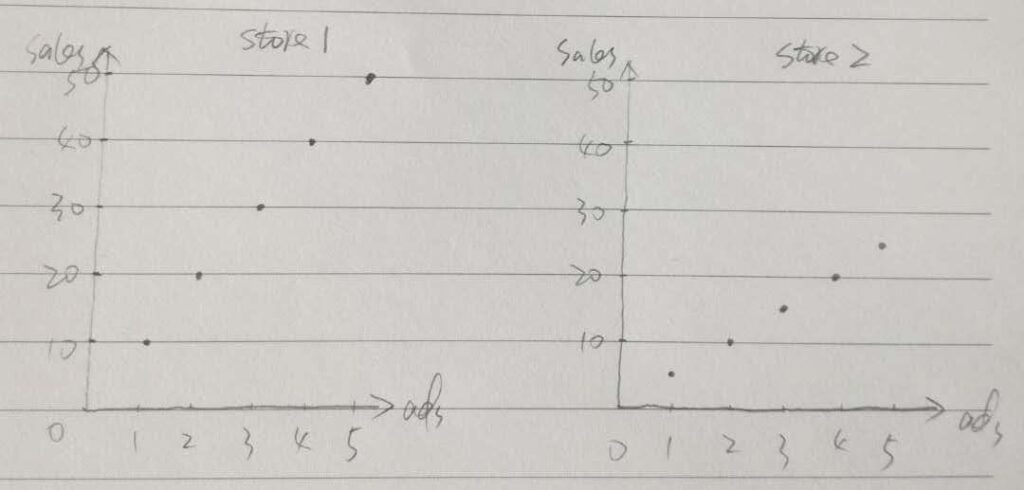
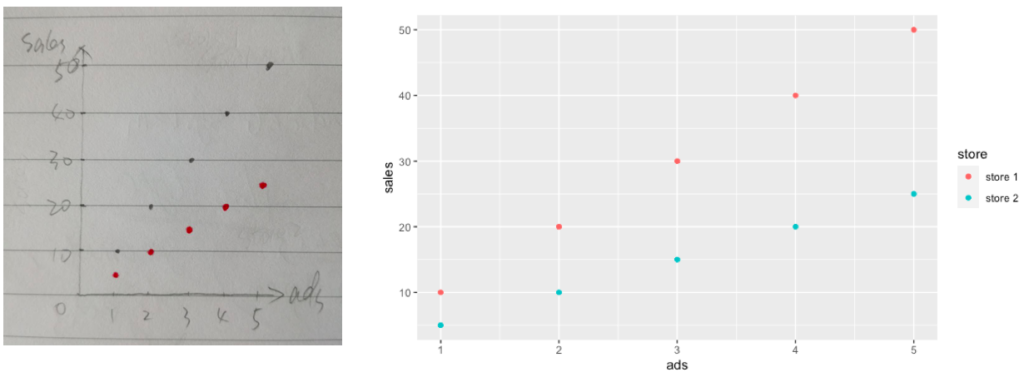
Let’s start with Step 6 in the last post, in which we were trying to draw two graphs side by side on the paper. In order to compare the patterns in two different datasets, we kept the same scales on the axes. You may wonder we can also draw two datasets on one graph as the scales are the same, as demonstrated below (the second dataset is drawn in red points).
Continue readingIn my last post about ggplot2 (ggplot2 Theme Elements Demonstration), I showed how to identify ggplot2 theme elements graphically. I did not expect that so many people like it when I shared it on Twitter and I feel so glad that it helps.
Today I want to share with you another useful way I found to learn ggplot2, which is learning ggplot2 with pen and paper. I got this idea a few days ago when I was trying to review the underlying grammar behind ggplot2 and just realized how similar it is to the way I drew math function graphs on paper in middle school. Let me show you how they are related and why it is a useful way to learn ggplot2.
Continue readingggplot2 is one of the most powerful packages in r for data visualizations and it is essential to master the underlying grammar of graphics to fully utilize its power. While the theming system of ggplot2 allows you to customize the appearance of the plot according to our needs in practice, it is always a frustration to identify the elements on the plot you want to change as you may find it difficult to remember the element names and their corresponding functions to modify, at least this is the case for me.