The previous post in this series: Learning ggplot2 on Paper – Components. The last post introduced ggplot2 seven components at a high level and how they are related to the way we draw math function graphs on paper in middle school.
This post will dive into the components of the layer, which is one of the most important ggplot2 components.
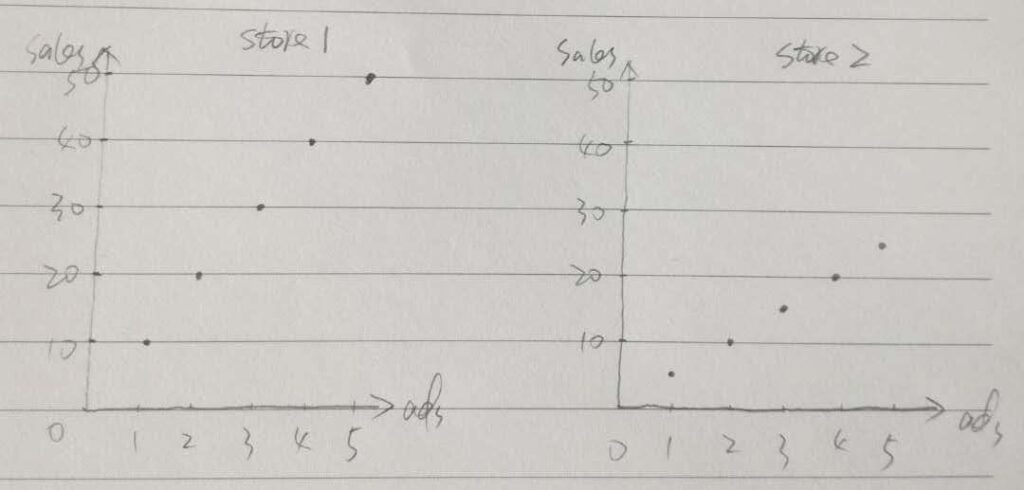
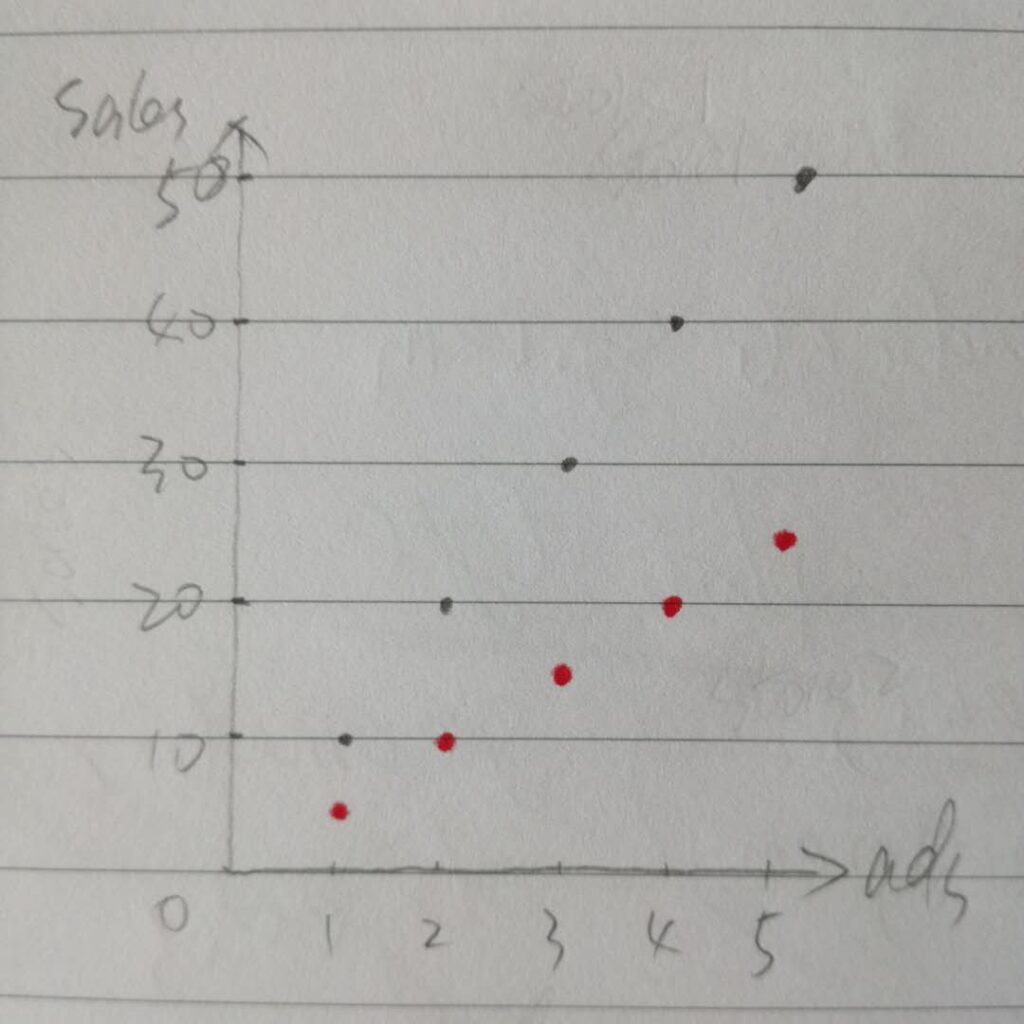
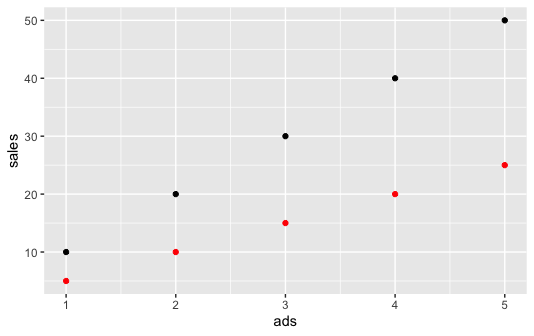
Let’s start with Step 6 in the last post, in which we were trying to draw two graphs side by side on the paper. In order to compare the patterns in two different datasets, we kept the same scales on the axes. You may wonder we can also draw two datasets on one graph as the scales are the same, as demonstrated below (the second dataset is drawn in red points).
Similarly, this can be easily done in ggplot2:
# Prepare data in R
data1 <- tibble(ads = 1:5, sales = seq(10, 50, 10), store = "store 1")
data2 <- tibble(ads = 1:5, sales = seq(5, 25, 5), store = "store 2")

# Plot two datasets
p <- ggplot(data = data1, aes(x = ads, y = sales)) +
  geom_point() +
  geom_point(data = data2, color = "red")

p
Layer Components
Please note that we asked ggplot2 to use another dataset in the second geom_point() function. This reveals the layer components. In essence, geom_point() is the shortcut of layer() function:
# Layer components
ggplot(data = data1, aes(x = ads, y = sales)) +
  layer(data = NULL,
        mapping = NULL,
        geom = "point",
        stat = "identity",
        position = "identity") +
  layer(data = data2,
        mapping = NULL,
        geom = "point",
        stat = "identity",
        position = "identity",
        params = list(color = "red"))
As shown above, basically layer has five components:
- Data: inherited the default data if not provided
- Mapping: inherited the default mapping if not provided
- Geom: the plot type such as “point”, “line”, and “bar”
- Stat: show the data as it is or make appropriate calculation
- Position: the position of the visual elements
Check ?layer() for more information.
Layer Types vs. Layer Attributes
In order to understand layer components we have to distinguish layer types and their corresponding attributes.
First, layer type is the type of visual elements on the plot and is classified by geom = “”. For example, geom = “point” or its shortcut of geom_point() tells ggplot2 we want a point layer, while geom_line() would be a line layer.
Second, layer attributes are the corresponding attributes or aesthetics of one specific layer type. Different layers would have different corresponding attributes. Point layer, for instance, could have position (e.g., x, y, the position on the coordinate system), color, size, alpha etc.
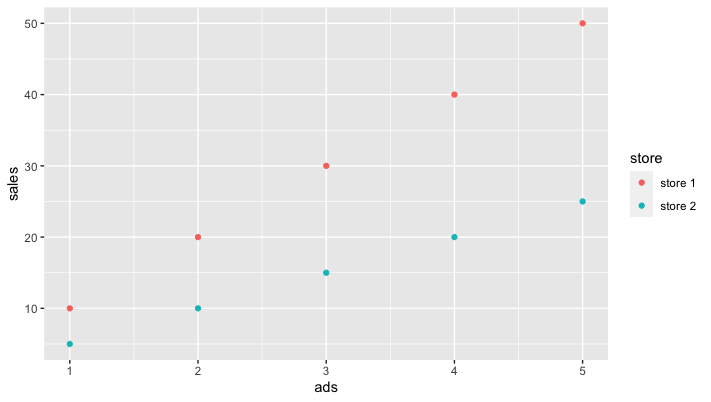
Mapping vs. Setting
ggplot2 is a data visualization tool to help us discover useful patterns in the data. Accordingly, most of the visual elements in the plot are related to the data. More specifically, this is called mapping, which maps data variables to visual elements on the plot. As you already know these attributes are specified within
Again, let’s use aes() to distinguish point color to plot a graph similar to what we drew on the paper.
# Prepare data in R
data1 <- tibble(ads = 1:5, sales = seq(10, 50, 10), store = "store 1")
data2 <- tibble(ads = 1:5, sales = seq(5, 25, 5), store = "store 2")
data <- data1 %>% bind_rows(data2)

# Attributes within aes()
p2 <- ggplot(data = data, aes(x = ads, y = sales, color = store)) +
  geom_point()

p2
On the other hand, sometimes we just want to distinguish visual elements in general and this is called setting, as what we did at the beginning of the post.
What if we put mapping arguments (e.g., color = store) out of
Hope this post could help you understand the five components of ggplot2 layers. Please let me know if you have any questions.