The previous two posts in this series of learning ggplot2 on paper:
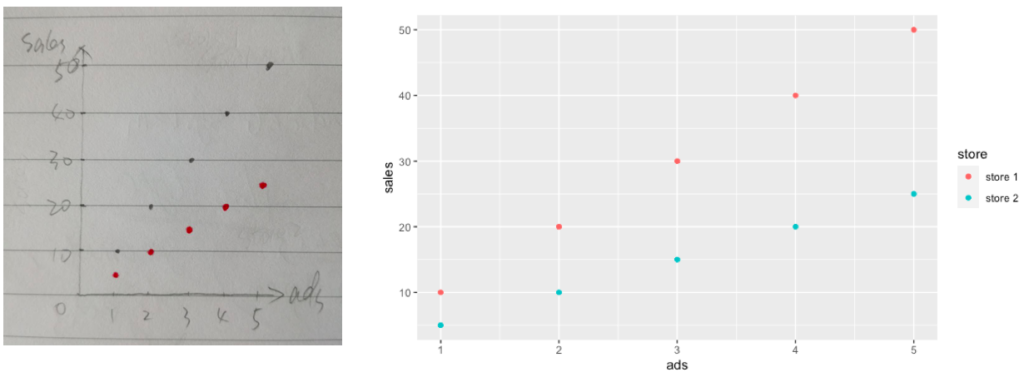
This post will continue to discuss another ggplot2 component, Scale. Let’s start with the graphs we drew in the last post of “Learning ggplot2 on Paper – Layer“, as shown here.
The previous two posts in this series of learning ggplot2 on paper:
This post will continue to discuss another ggplot2 component, Scale. Let’s start with the graphs we drew in the last post of “Learning ggplot2 on Paper – Layer“, as shown here.