Category Archives: R Programming

R Language Brief and R Applications

Learning ggplot2 on Paper – Layer

The previous post in this series: Learning ggplot2 on Paper – Components. The last post introduced ggplot2 seven components at a high level and how they are related to the way we draw math function graphs on paper in middle school.

This post will dive into the components of the layer, which is one of the most important ggplot2 components.
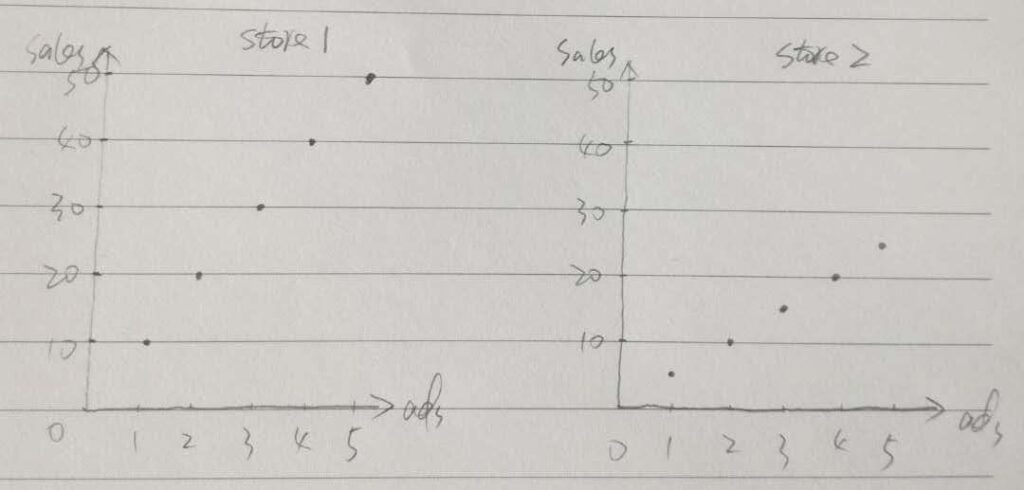
step6

Let’s start with Step 6 in the last post, in which we were trying to draw two graphs side by side on the paper. In order to compare the patterns in two different datasets, we kept the same scales on the axes. You may wonder we can also draw two datasets on one graph as the scales are the same, as demonstrated below (the second dataset is drawn in red points).

Continue reading

Learning ggplot2 on Paper – Components

In my last post about ggplot2 (ggplot2 Theme Elements Demonstration), I showed how to identify ggplot2 theme elements graphically. I did not expect that so many people like it when I shared it on Twitter and I feel so glad that it helps.

Today I want to share with you another useful way I found to learn ggplot2, which is learning ggplot2 with pen and paper. I got this idea a few days ago when I was trying to review the underlying grammar behind ggplot2 and just realized how similar it is to the way I drew math function graphs on paper in middle school. Let me show you how they are related and why it is a useful way to learn ggplot2.

Continue reading

Kindle Vocabulary Builder Export For Free

In the past two months, I spent most of the time on Tidyverse and Harry Potter books and finally I completed all of them lately, feeling appreciated in the quarantine life.

These two different things connected together when I was looking for ways to export Kindle Vocabulary Builder, which is a vocabulary list consists of the words I look up in the kindle.

Continue reading

Probability in R

I can still remember the nightmare when I first studied Statistics in my Bachelor a few years ago. It was a nightmare because we were asked to do all the exercises and exams on paper without cheat sheets and even calculators. However, the Statistics course in my Master turned out much more interesting as all the exercises and exams were conducted online and we were allowed to use Excel formulas as well. A couple of days ago when I came across Foundations of Probability in R on DataCamp I realized that learning statistics could be much better with random simulation and data visualization in R. This course is quite fundamental and nothing new to me but the idea behind it is very appealing.

Binomial Distribution

Let’s say I’m flipping a fair coin (50% chance of “heads” and 50% chance of “tails”) 10 times in an experiment, how many “heads” I will end up with?

If lucky, I may have 10 “heads” at most, or on the other hand, I don’t have any “heads” at all, but most likely it is in between. Let’s suppose the number of “heads” (X) is 4 at my first try.

Continue reading

ggplot2 Theme Elements Demonstration

ggplot2 is one of the most powerful packages in r for data visualizations and it is essential to master the underlying grammar of graphics to fully utilize its power. While the theming system of ggplot2 allows you to customize the appearance of the plot according to our needs in practice, it is always a frustration to identify the elements on the plot you want to change as you may find it difficult to remember the element names and their corresponding functions to modify, at least this is the case for me.

Continue reading