The previous post in this series: Learning ggplot2 on Paper – Components. The last post introduced ggplot2 seven components at a high level and how they are related to the way we draw math function graphs on paper in middle school.
This post will dive into the components of the layer, which is one of the most important ggplot2 components.
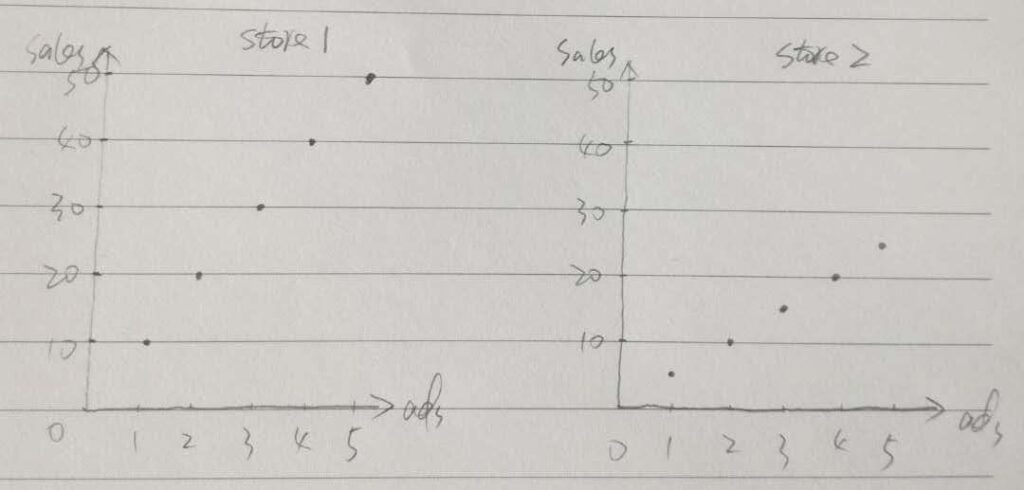
Let’s start with Step 6 in the last post, in which we were trying to draw two graphs side by side on the paper. In order to compare the patterns in two different datasets, we kept the same scales on the axes. You may wonder we can also draw two datasets on one graph as the scales are the same, as demonstrated below (the second dataset is drawn in red points).
Continue reading