Following Quadratic Programming with R, this is another example of how to solve quadratic programming problem with R package “quadprog“.
Why Another Example?
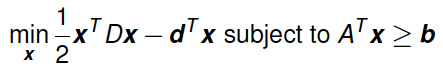
“quadprog” package requires us to rewrite the quadratic equation in the proper matrix equation as above. You may have the following questions:
- What if our equation is to maximize the objective function instead of minimize it?
- What if the inequality constraints are “less than (<=)” instead of “more than (>=)”?
- What if there is no equality constraints?
- …
To give you an idea how to answer these questions, this post will give you another example.
Continue reading